
Your first investigation
Use Python 3.11–3.14 and a pandas dataframe. Fieldwork needs pandas and NumPy; it does not require DICOM tools, a plotting server or a notebook.
Install Fieldwork 0.1.0
Section titled “Install Fieldwork 0.1.0”pip install fieldwork==0.1.0From a uv project, use uv add fieldwork==0.1.0. This is the initial alpha release; see Documentation source for its exact tag and commit.
Make a small dataset
Section titled “Make a small dataset”import pandas as pdimport fieldwork as fw
df = pd.DataFrame({ "site": ["North", "North", "South", "South"], "exam": [1, 1, 2, 2], "image_1": [10, 11, 20, 21], "image_2": [12, 13, 22, None],}, index=[0, 0, 0, 0])Each exam has two rows. The second image is missing on the last row. Duplicate indexes are intentional.
Orient, then choose a path
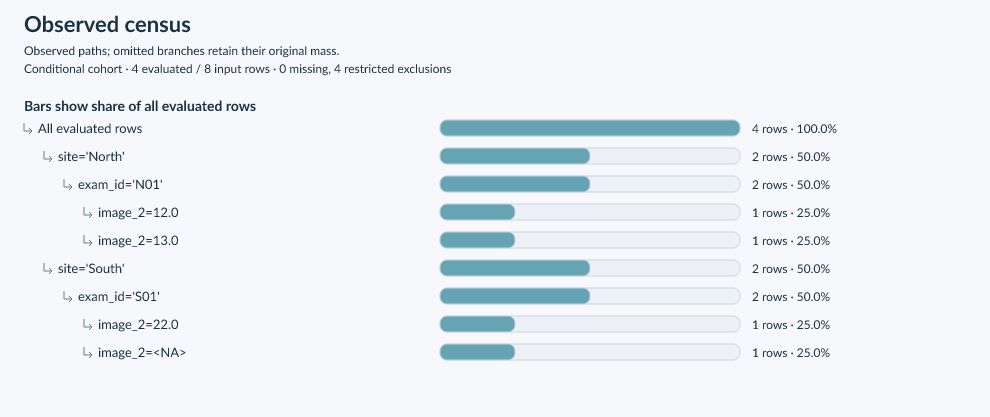
Section titled “Orient, then choose a path”overview = fw.explore(df)print(overview)paths = fw.suggest_paths(df, features=["site", "exam"])if paths.best is not None: tree = paths.best.census(df) print(tree)Site and exam are equivalent groupings in this small example; both describe two groups. In a larger dataset with several exams per site, supported nesting favors site before exam. Explicit dimensions always work: fw.census(df, ["site", "exam"]).
Inspect the missing image
Section titled “Inspect the missing image”availability = fw.missingness(df, min_implication=0.75)edge = next( f for f in availability["findings"] if f["pattern"] == "presence_implication" and [ref["column"] for ref in f["features"]] == ["image_1", "image_2"])exceptions = availability.inspect(df, edge["id"], exceptions=True)assert exceptions["exam"].tolist() == [2]The measured conditional presence is 3/4. Continue with families and exceptions, or open the worked notebook.