
fw.census
Use fw.census to explain a table through a chosen order of dimensions. Every node represents an observed prefix: first a broad group, then a subdivision within that group, then another. Counts and parent shares keep each step anchored to its population.
A census answers “what sits inside this group?” Use suggest_paths to find a starting order when you do not already have one.
Jump to the worked example or the argument reference.
Function reference
Section titled “Function reference”fw.census( df, dimensions, *, top_n=None, top_n_mode='post', top_n_per_parent=False, min_retained_fraction=0.01, max_depth=None, max_levels=100, max_nodes=10000, min_count=1, dropna=False, schema=None, scope=None, missing=None, table_id="table", progress=None, cancel=None, timeout=None, safe_errors=None,)This page describes Fieldwork 0.3.2. Import the package with import fieldwork as fw. View the documented source.
Arguments
Section titled “Arguments”| Argument | Type / default | Effect |
|---|---|---|
df |
pandas.DataFrame; required | The source table. Analysis preserves its values and row order; duplicate column labels are rejected. |
dimensions |
iterable of str; required | Ordered columns to analyze. Non-string column labels are named by their string form; each column must exist and be selected only once. |
scope |
Scope or None; None |
A saved row selection tied to this dataframe; None uses every row. Construct with fw.Scope.from_positions(df, positions). Pass the original dataframe with its scope, rather than a reordered or changed copy. |
missing |
mapping or None; None |
Column names mapped to lists of sentinel values, for example {"reading": [-999]}. Native nulls are always missing. Sentinels affect this analysis without replacing source values. |
table_id |
str; "table" |
Nonempty table identity recorded with the evidence. It does not bypass source-fingerprint checks. |
progress |
bool or callable; None |
Silent by default; True displays progress, or pass a synchronous ProgressEvent callback. See runtime controls. |
cancel |
CancellationToken or None; None |
Cooperative cancellation token; cancellation raises AnalysisCancelled without returning a partial result. |
timeout |
float or None; None |
Finite nonnegative seconds from call start; None disables the cooperative deadline. A running pandas/NumPy work item must finish before cancellation. |
safe_errors |
bool or None; None |
True raises any other failure as AnalysisError, naming the operation, phase and column without echoing the original message, which can quote cell values. See runtime controls. |
Census options
Section titled “Census options”These are accepted directly as keyword arguments in fw.census(...).
| Argument | Type / default | Effect |
|---|---|---|
top_n |
positive int or None; None |
Maximum selected levels per dimension (globally by default, or per parent). None disables this selector. Its population effect depends on top_n_mode. |
top_n_mode |
“post” or “pre”; 'post' |
"post" limits reported branches after counting. "pre" first restricts rows to the selected levels and recomputes counts on that cohort. |
top_n_per_parent |
bool; False |
False selects each dimension’s most frequent levels globally, then applies those sets at every parent. True chooses within each surviving prefix; in pre mode, selection proceeds recursively. |
min_retained_fraction |
float in [0, 1]; 0.01 |
Warn when preselection retains less than this fraction of eligible rows. This is a warning threshold, not an additional row filter. |
max_depth |
positive int or None; None |
Use only this many leading dimensions. None uses all requested dimensions; missing exclusions apply to the active dimensions. |
max_levels |
nonnegative int or None; 100 |
Maximum reported children per parent, after top-N and minimum-count selection. None removes this cap. |
max_nodes |
nonnegative int or None; 10000 |
Maximum emitted non-root nodes, allocated in breadth-first production order. The root and omitted mass remain; None removes the cap. |
min_count |
nonnegative int; 1 |
Minimum count for an emitted branch. Suppressed branches remain in population denominators and omitted-child mass. |
dropna |
bool; False |
False includes native or declared missing as a level. True excludes rows missing any active dimension before counting. |
schema |
mapping or None; None |
Caller-supplied column roles: id, categorical, continuous, or unknown. Roles annotate evidence; they do not transform values or silently remove explicitly selected columns. |
Returns and output choices
Section titled “Returns and output choices”Returns a fieldwork.Result with kind="census". tree.root is the evaluated population; tree.nodes contains observed prefixes, each linked to its parent by parent_id and naming its own column and value. Nodes retain count, share_of_parent, share_of_total, omitted_child_rows, omitted_child_levels, and stop_reasons. The tree reports evaluated_rows, missing_excluded_rows, and restriction_excluded_rows; after a pre-selection, retained_sets lists the values kept for each dimension. Values are plain JSON, with missing as None. The result also records source, scope, missing_convention, and the parameters that produced it.
Read tree.nodes directly for calculations, or use visualization_data for labelled rows with both kinds of share. Render with plaintext for terminal output, SVG for a figure, or HTML for a report. to_dict() saves the result, and recompute(df, top_n=2) reruns it on the same verified dataframe with changed options.
Interpretation and boundaries
Section titled “Interpretation and boundaries”top_n_mode="post" limits emitted branches while retaining the population. "pre" selects a cohort before counting and changes the denominator. Neither omitted branches nor unexpanded nodes are evidence of zero observations. Read the scope and omission fields before interpreting the picture.
dropna=True excludes missing values across the active dimensions (after max_depth). A scope restricts rows before counting, and missing sentinels count as missing values; both are recorded with the result. Preselection that removes every eligible row raises ValueError (DEGENERATE_TOP_N); invalid limits or modes also raise ValueError.
Walkthrough: follow the loans through a library
Section titled “Walkthrough: follow the loans through a library”A library service wants to describe a day’s borrowing: which branch handled each loan, which collection it came from, and whether it was print or an ebook. An ordered census lets us move from the whole service to increasingly specific prefixes: branch → collection → format.
The example contains 24 loans. Each row is one checkout transaction; it is not a unique patron or a unique book. Download the complete, checked script to reproduce the results and save the figure.
Build a day small enough to count by hand
Section titled “Build a day small enough to count by hand”Five batches describe every observed combination. Expanding them produces the
transaction table that fw.census expects; the batch sizes are not supplied as
weights.
import pandas as pdimport fieldwork as fw
batches = [    ("Central", "Adult", "Print", 8),    ("Central", "Adult", "Ebook", 4),    ("Central", "Children", "Print", 4),    ("Riverside", "Adult", "Print", 2),    ("Riverside", "Children", "Print", 6),]rows = []for branch, collection, format_, n in batches:    for _ in range(n):        rows.append((branch, collection, format_))
loans = pd.DataFrame(    rows,    columns=["branch", "collection", "format"],)print(f"Loans: {len(loans)}")
Loans: 24Read each level in the context of its parent
Section titled “Read each level in the context of its parent”dimensions = ["branch", "collection", "format"]full = fw.census(loans, dimensions)print(fw.render_plaintext(full))Fieldwork · censusCensus (computed) Input population · 24 evaluated / 24 input rows · 0 missing, 0 restricted exclusions path: branch > collection > format total: 24 rows branch=Central: 16 rows collection=Adult: 12 rows format=Print: 8 rows format=Ebook: 4 rows collection=Children: 4 rows format=Print: 4 rows branch=Riverside: 8 rows collection=Children: 6 rows format=Print: 6 rows collection=Adult: 2 rows format=Print: 2 rowsCentral accounts for 16 loans. Its Adult node counts 12 loans satisfying both conditions. Its Print child counts eight satisfying all three. Adding every node’s count would count the same loans repeatedly; add siblings when checking a parent.
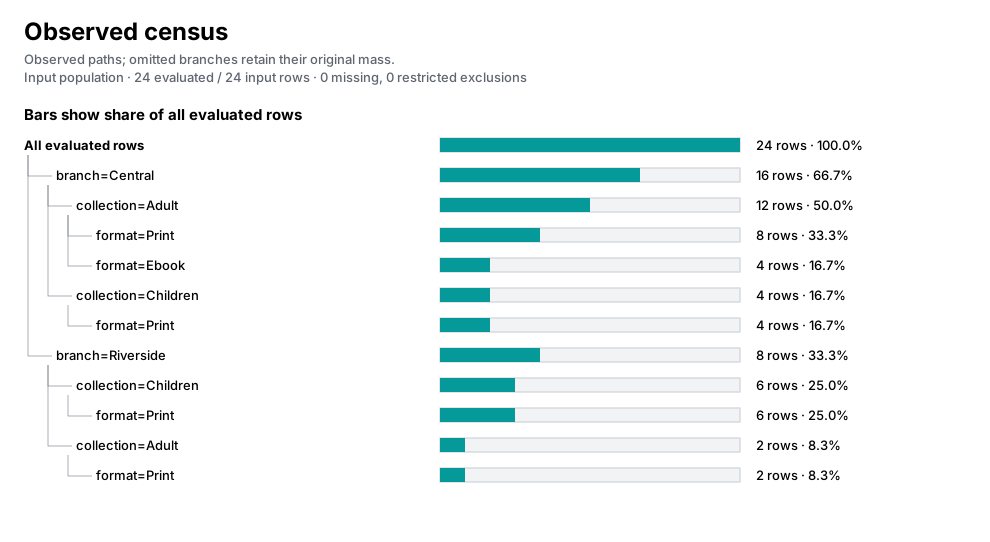
This figure is generated by fw.render_svg(full). Save it for a report with the export step below.
Read percentages alongside the counts
Section titled “Read percentages alongside the counts”For a table of the figure’s values, use visualization_data. It supplies display labels and both kinds of share without needing to follow node IDs yourself:
figure_data = fw.visualization_data(full)groups = pd.DataFrame(figure_data["rows"])central_collections = groups[ groups["parent_label"] == "branch=Central"]print( central_collections[ ["label", "count", "parent_share", "share"] ].to_string(index=False)) label count parent_share share collection=Adult 12 0.75 0.500000collection=Children 4 0.25 0.166667Adult loans are 12/16 = 75% of Central’s loans (parent_share) and 12/24 = 50% of the whole day (share). The same count answers different questions depending on its denominator.
A shorter tree and a smaller population answer different questions
Section titled “A shorter tree and a smaller population answer different questions”Keep just one child per parent to see the largest route through the tree. Here
top_n_per_parent=True explicitly makes the choice local to each prefix; without
it, top_n selects levels using each dimension’s global counts.
post = fw.census(    loans, dimensions, top_n=1, top_n_mode="post", top_n_per_parent=True)print("Keep the original population:")print(fw.render_plaintext(post))
pre = fw.census(    loans, dimensions, top_n=1, top_n_mode="pre", top_n_per_parent=True)print("Count only the selected rows:")print(fw.render_plaintext(pre))
Keep the original population:Fieldwork · censusCensus (partial) Input population · 24 evaluated / 24 input rows · 0 missing, 0 restricted exclusions path: branch > collection > format total: 24 rows ... 8 rows in 1 child level omitted (top_n) branch=Central: 16 rows ... 4 rows in 1 child level omitted (top_n) collection=Adult: 12 rows ... 4 rows in 1 child level omitted (top_n) format=Print: 8 rowsCount only the selected rows:Fieldwork · censusCensus (computed, conditional) Conditional cohort · 8 evaluated / 24 input rows · 0 missing, 16 restricted exclusions path: branch > collection > format total: 8 rows branch=Central: 8 rows collection=Adult: 8 rows format=Print: 8 rowsPost selection keeps the original denominators. All 24 loans are evaluated. Eight Riverside loans are omitted directly under the root; four Children’s loans are omitted under Central; four ebooks are omitted under Central/Adult. These are three different parent contexts, not three estimates of the same missing total. In this one-route example, the disjoint omissions account for the 16 loans outside the displayed eight-loan leaf. The tree is partial: Riverside has borrowing even though it is absent from this display.
Pre selection changes the cohort. It first follows the largest branch, its
largest collection, and that collection’s largest format. Only the eight Central
Adult Print loans survive. Counts and shares are then recomputed on those eight:
Central is now 100% of the selected cohort. The computed status describes that
cohort’s complete tree; it does not mean the other 16 input loans were analyzed
as part of it. The population line records those 16 as restricted exclusions.
Turn the tree around for the next question
Section titled “Turn the tree around for the next question”The original tree makes Riverside look smaller overall. To ask where Children’s borrowing happens, put collection first:
collection_first = fw.census( loans, ["collection", "branch"], max_depth=2)print(fw.render_plaintext(collection_first))Fieldwork · censusCensus (computed) Input population · 24 evaluated / 24 input rows · 0 missing, 0 restricted exclusions path: collection > branch total: 24 rows collection=Adult: 14 rows branch=Central: 12 rows branch=Riverside: 2 rows collection=Children: 10 rows branch=Riverside: 6 rows branch=Central: 4 rowsRiverside handles 6/10 = 60% of Children’s loans, despite handling only 8/24 of all loans. That is a reason to inspect collection demand by branch over more days. This single synthetic day counts transactions; it cannot tell us whether the pattern reflects patron preferences, opening hours, or which books were available.
Save the result for sharing
Section titled “Save the result for sharing”Save the figure or report in your working directory:
from pathlib import Path
Path("census.svg").write_text(fw.render_svg(full), encoding="utf-8")
Continue exploring
Section titled “Continue exploring”fw.suggest_paths, fw.levels, fw.explore. See results and configuration for serialization and result-method contracts.